
BRK.A
Berkshire Hathaway Inc
The Quant Moat of Berkshire
Is There A Quantitative Moat?I've thought over the past few days on how to do this step.
If you've been following along with the research, we know the usual steps of assessing Berkshire are different, and we've been using a sum-of-the-parts (SOTP) method of valuing Berkshire - just like Buffett recommends.
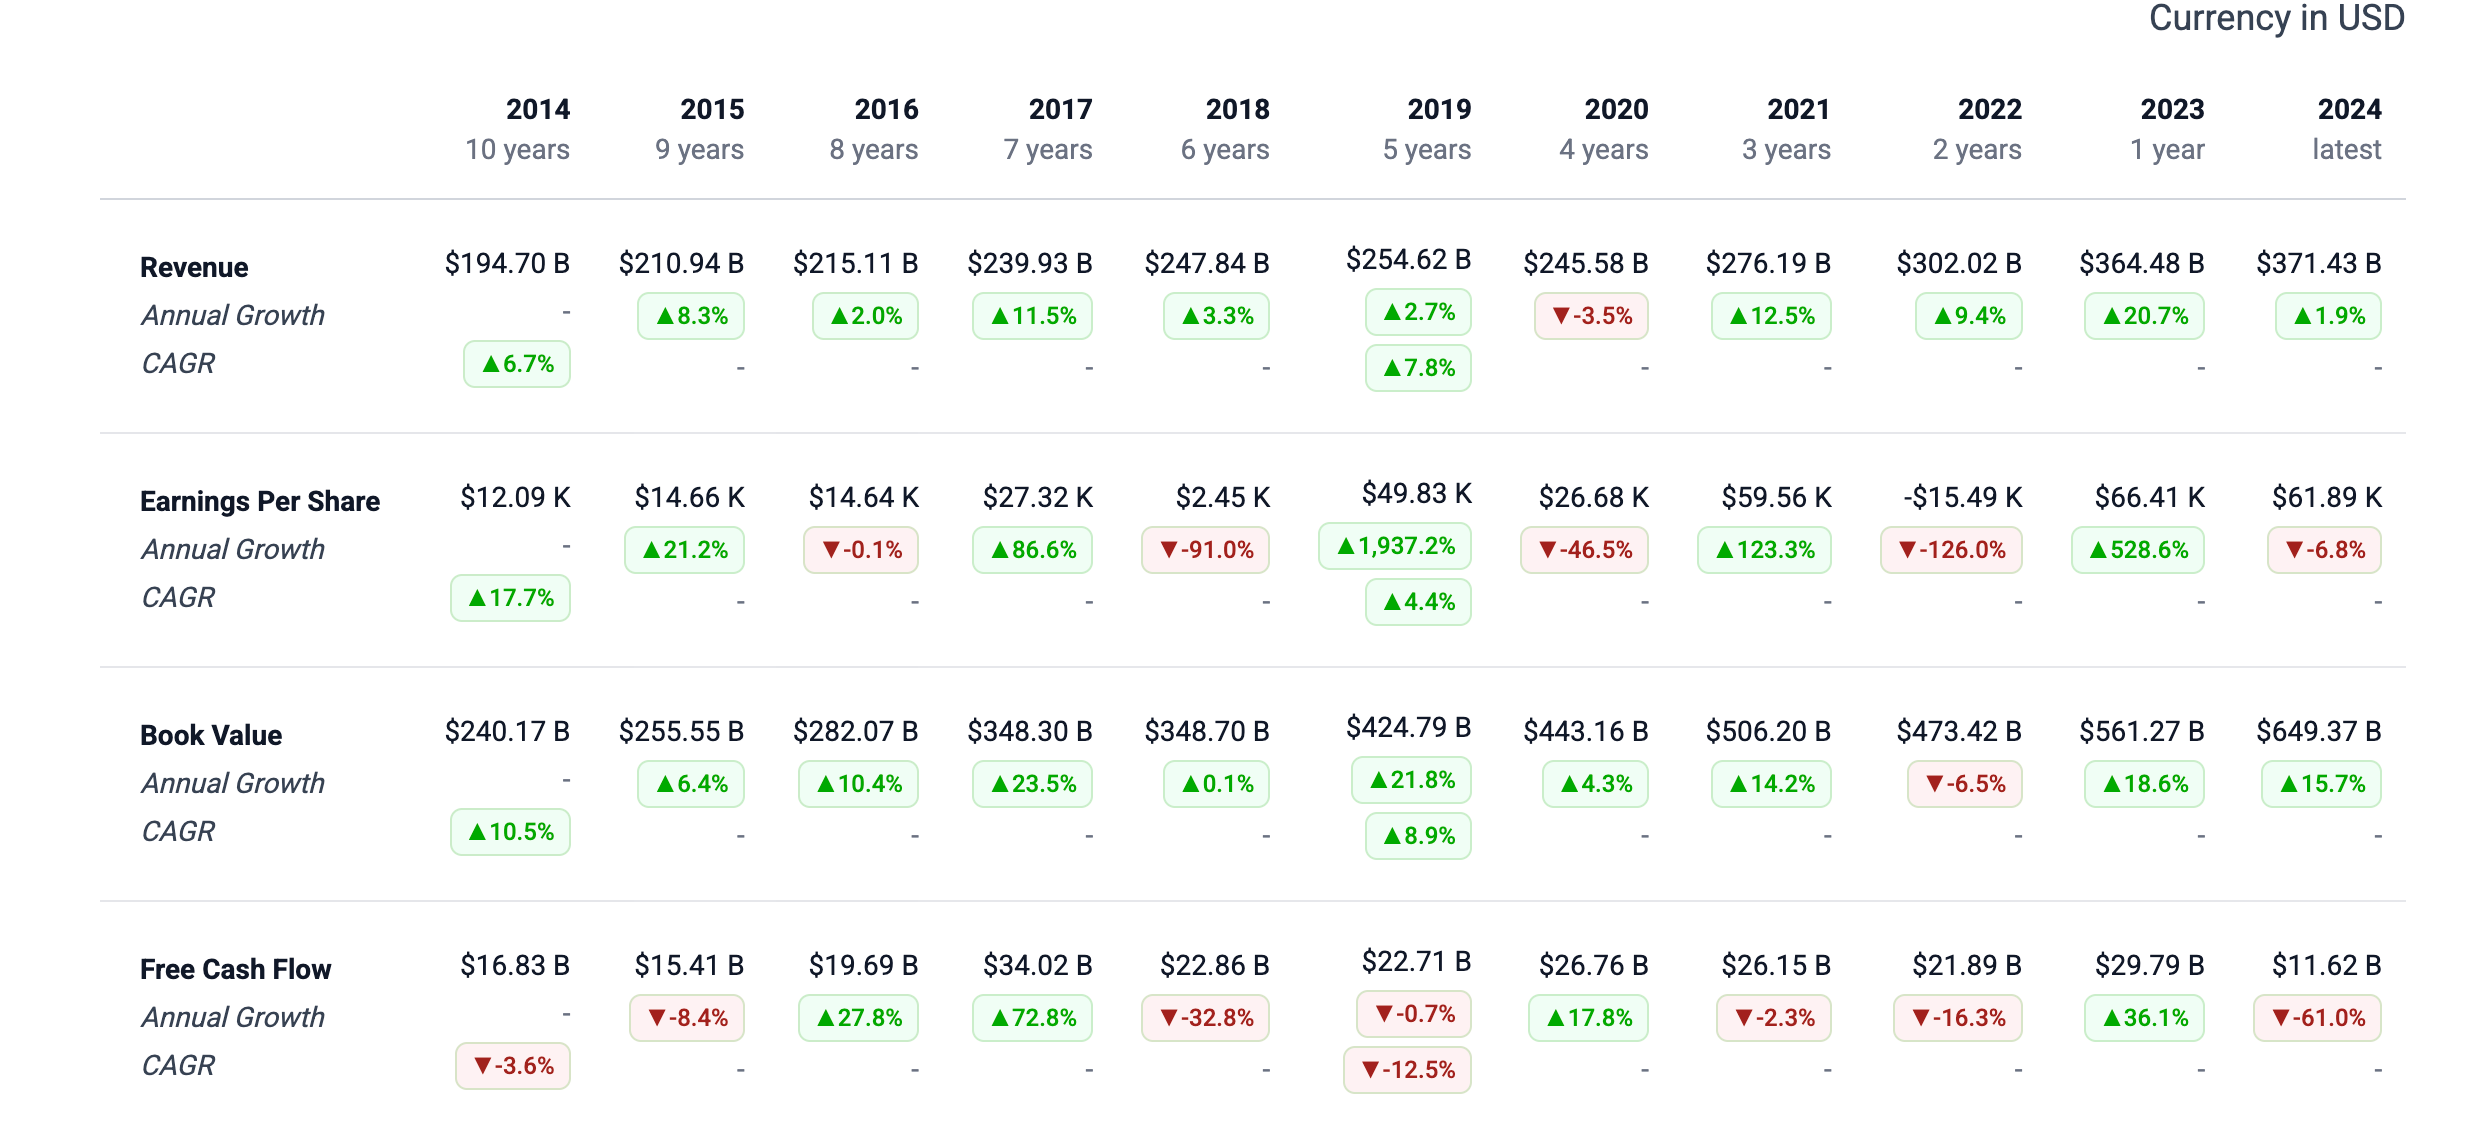
So our usual check of Revenue/EPS/Book Value/FCF growth for quant moat doesn't work for Berkshire.
Let's think differently.
Let's go back to first principles.
What do we mean by quantitative moat?
A company has a quantitative moat if it shows persistent, measurable outperformance in at least one of these buckets:
Sustained excess compounding vs a relevant benchmark
Structurally higher profitability or lower capital costs than peers
Resilience: better outcomes in stress (down markets, crises) without breaking the model
Repeatability: the advantage shows up year after year in operating results, not only valuation swings
Let's break each of these down.
1) Long-term excess compounding (yes, and it is huge)
Berkshire publishes the cleanest long-run scoreboard in public markets: annual % change in per-share market value vs S&P 500 total return. Buffett's used that as his "yardstick" since the 1950s in the Buffett Partnership.
From 1965 to 2024, Berkshire reports:
Compounded annual gain: 19.9% vs 10.4% for the S&P 500 (with dividends)
Overall gain: 5,502,284% vs 39,054% for the S&P 500
So yup, easily passes this test.
2) Insurance economics: cheap (sometimes negative-cost) capital at scale (this is the core quantitative moat)
Berkshire defines float as policyholder funds held for investment and discloses that float grew from ~$129B (end of 2019) to ~$171B (end of 2024).
The cost of that float is unusually low. Berkshire says its combined insurance operations produced pre-tax underwriting gains in 2024 and 2023, and the average cost of float was negative in each year.
That “negative cost of float” is a quantitative moat statement in plain English: Berkshire is effectively being paid to hold investable capital not by investors, but policyholders.
This, coupled with the fact that underwriting profits are large in absolute dollars, shows me that their insurance arm continues to be the powerhouse of Berkshire.
3) Resilience test: does the moat show up in bad markets?
Berkshire’s own performance table makes this easy:
2022: Berkshire +4.0% vs S&P 500 -18.1%
2008: Berkshire -31.8% vs S&P 500 -37.0%
This is not “never goes down,” but it is evidence of relative resilience, which is a real quantitative moat characteristic for a capital allocator with insurance liabilities.
Buffett and Munger have long said that Berkshire is built to thrive during bad times.
4) Operating earnings power: repeatable cash generation
Buffett emphasizes operating earnings as the cleaner measure of underlying performance.
Berkshire states: operating earnings were $47.4B in 2024 (vs $37.35B in 2023).
This matters for a quantitative moat because it shows the conglomerate is not merely a stock portfolio. It is a large set of operating businesses producing recurring earnings that can be reinvested.
Overal sentiment: Very Bullish