
KO
Coca-Cola Co
Coke's Quant Moat
Is There A Quantitative Moat?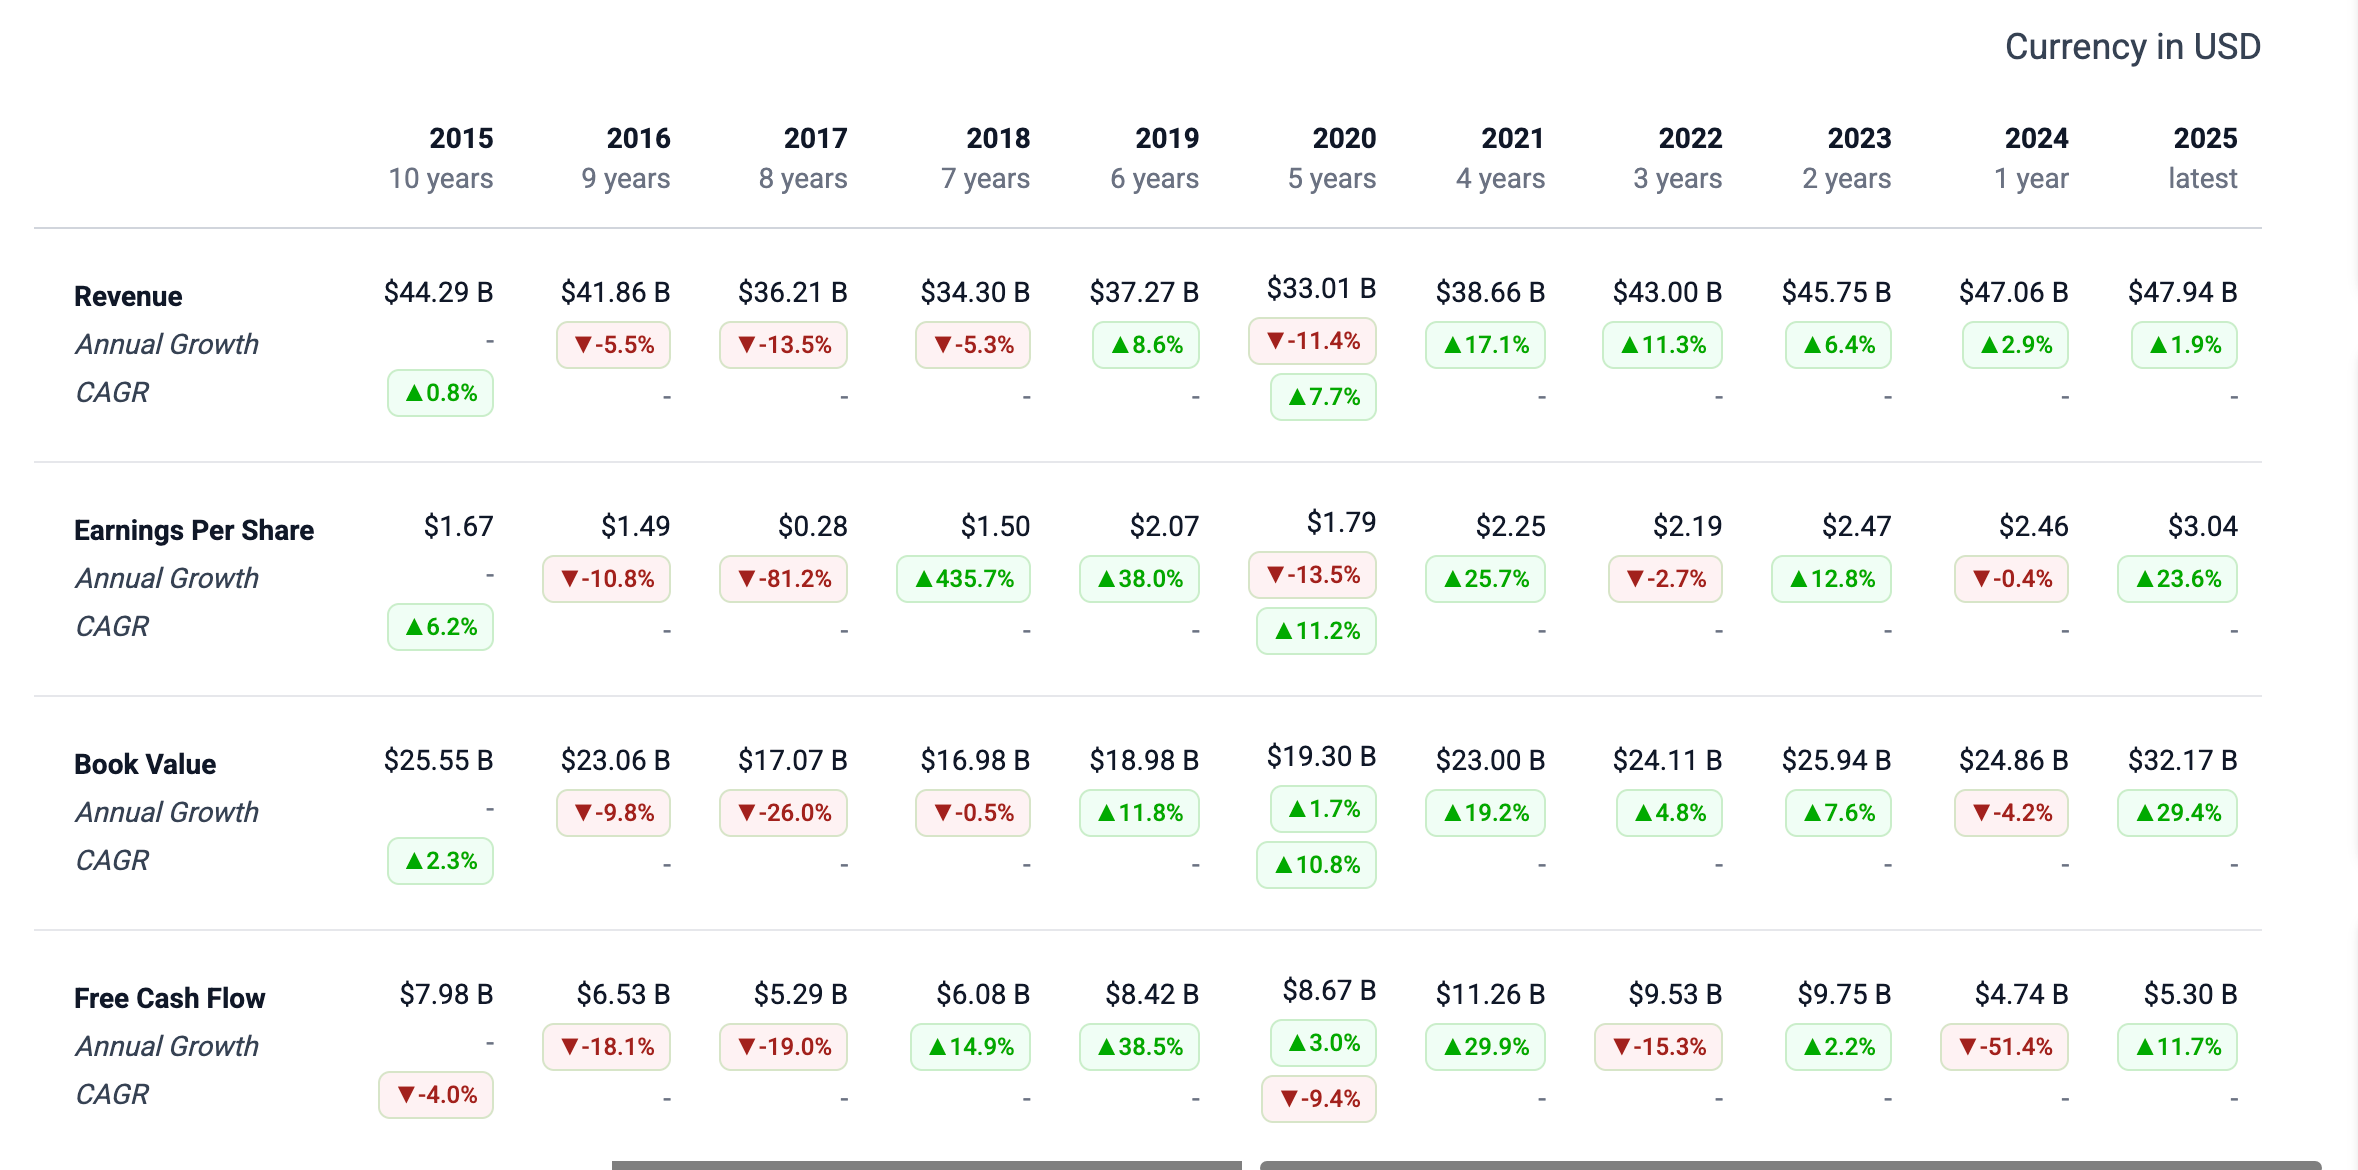
Free Cash Flow
Free cash flow has been going down: 4% over a 10-year period and 9% over a 5-year period.
They had a huge drop in 2024, down 51%... This appears to be due to the fairlife purchase when Coca-Cola bought fairlife in 2020. The deal included a contingent consideration (earnout) that paid based on fairlife hitting performance milestones.
Fairlife blew past them all, so the bill came due in Q1 of 2025.
Without the fairlife payout, the 2025 FCF would be $11.4B - which is way nicer.
Revenue
The dip and the recovery are mostly portfolio surgery, not organic decline. The scary-looking 2015-2020 slide ($44.29B → $33.01B, negative growth four years running) is largely refranchising. KO deliberately sold off its capital-heavy company-owned bottling operations to franchise partners between roughly 2015 and 2017.
That intentionally shrinks reported revenue (you stop booking bottling sales) while raising margins and returns (you keep the high-margin concentrate business).
So the 10-year revenue CAGR of 0.8% badly understates the business. The 5-year (7.7%) and the post-2020 climb to $47.94B is the real underlying growth showing through now that refranchising is done and pricing power kicked in.
EPS
EPS shows the acceleration is pricing power + margin mix + fairlife.
The 5-year EPS CAGR of 11.2% and the 23% jump to $3.04 in 2025 reflect that post-refranchising the company is structurally higher-margin, plus strong price/mix in 2022-2025 (inflationary pricing that stuck), plus fairlife and other premium brands (Topo Chico, Coke Zero) growing fast.
The asset-light model means revenue growth drops to the bottom line more efficiently than it did a decade ago, and their incredible pricing power.
Book Value
Book value: the 2025 jump to $32.17B (+29.4%) is retained earnings compounding. After years bouncing in the high teens/low $20Bs (refranchising wrote down a lot of assets), the recent acceleration is simply strong net income piling up faster than it's paid out, plus the equity value of investments. Book value growth following EPS growth with a lag is exactly what you'd expect.
Conclusion
The chart is almost an optical illusion, and that's the interesting angle to me: three of the four rows were distorted by deliberate strategy (refranchising) and the fourth by a one-time payment (fairlife). Someone screening this on autopilot sees "revenue barely grew in 10 years and FCF is collapsing" and walks away.
The reality is a company that shed its low-margin guts, raised its margin profile, and just wrote a $6.1B check because an acquisition outperformed. The numbers that look like decay are mostly the residue of good decisions.
Sentiment: Bullish