

VITL
Vital Farms Inc
$1.35 Billion ??
(There was a bug that didn't allow me to post my draft from the DCF step so i had to post like this.)
I want to use this post as a exercise in expanding my understanding of the philosophy behind the Discounted Cash Flow model. This will allow me to do two things.
1. Understand the premise of why DCF is a valid and useful valuation method.
2. Sharpen my reasoning around the assumptions necessary to give reasonable figures for the calculation method.
What is Discounted Cash Flow?
Discounted cash flow is a valuation method used to estimate the intrinsic value of a company based on the available future free cash flows for the business being evaluated.
Okay... what does that mean??
First I needed to understand what is a free cash flow!
Free cash flow is defined as follows: "free cash flow is the actual cash a company generates after covering its operating expenses and capital expenditures (such as equipment or property maintenance). It represents the money available to pay dividends, reduce debt, or fund expansion." - Investopedia
hmm still a bit too nebulous. How can this be explained to someone unfamiliar with accounting terminology such as operating expenses and capital expenditures?
How about this analogy:
To understand it in simple terms, consider how you might manage your personal finances:
Your Take-Home Pay: This is similar to a company's total money brought in from sales.
Essential Living Expenses: This represents a company's operating costs (employee salaries, rent, suppliers).
Upkeep and Repairs: This is like a company's capital expenditures (CapEx)—the money spent to buy, build, or upgrade long-term physical assets (such as machinery, buildings, or tech).
Free Cash Flow is the exact amount of money remaining in your bank account after you have paid for all of your living expenses and maintained your household.
Okay. That feels a little more relatable and understandable.
The specific formula for Free Cash Flow is FCF = Operating Cash Flow - Capital Expenditures (or per our analogy: FCF = Take-Home Pay - Living Expenses - Upkeep/Repairs)
Benefits of Using Free Cash Flow
As a measure of profitability and financial health, free cash flow offers several benefits over other points of analysis.
Because FCF accounts for changes in working capital, it can provide important insights into a company's value, its operational efficiency, and the health of its fundamental trends. For example:
A decrease in accounts payable could mean that vendors are requiring faster payment.
An increase in accounts receivable could mean the company is not collecting money from its customers, and is negative for cash flow.
An increase in inventory (outflow) could indicate a building stockpile of unsold products.
By including working capital, free cash flow provides an insight that is missing from the income statement.
Insights to be Gained in Free Cash Flow Analysis
For example, assume that a company made $50,000,000 per year in net income each year for the last decade. This number would appear on the income statement and would lead investors or analysts to assume that the company is in stable financial health.
However, a look at the free cash flow might show a different story. If FCF was dropping over the last two years, the numbers might indicate that inventories were rising (outflow), customers were delaying payments (inflow), or vendors were demanding faster payments (outflow). These would be worrisome trends, indicating the potential for future problems.
In this situation, FCF has revealed financial weaknesses that wouldn’t be apparent from an examination of the income statement.
Looking at FCF is also helpful for potential shareholders or lenders who want to evaluate how likely it is that the company will be able to pay its expected dividends or interest. If the company’s debt payments are deducted from free cash flow to the firm (FCFF), a lender would have a better idea of the quality of cash flows available for paying additional debt.
Limitations of Using Free Cash Flow
Like any tool for financial analysis, FCF has limitations in what it can reveal.
Depreciation
One major drawback is that purchases that depreciate over time are subtracted from FCF in the year they are made, rather than being spread across multiple years. As a result, free cash flow can seem to indicate a dramatic short-term change in a company’s finances that would not appear in other measures of financial health.
Imagine a company has earnings before interest, taxes, depreciation, and amortization (EBITDA) of $1,000,000 in a given year. This company has had no changes in working capital (equal to current assets minus current liabilities). However, it bought new equipment worth $800,000 at the end of the year. The expense of the new equipment will be spread out over time via depreciation on the income statement, which evens out the impact on earnings.
But because FCF accounts for the cash spent on new equipment in the current year, the company will report $200,000 FCF ($1,000,000 EBITDA - $800,000 equipment) on $1,000,000 of EBITDA that year. If we assume that everything else remains the same and there are no further equipment purchases, EBITDA and FCF will be equal again the following year.
In this situation, an investor will have to determine why FCF dipped so quickly in one year only to return to previous levels, and whether that change is likely to continue.
Okay I am feeling better about my understanding of Free Cash Flow and why it is a valid metric for understanding financial health. Now to understand the DCF valuation method and do the calculation!
Okay so let us say this a little differently this time.
What is Discounted Cash Flow?
Discounted cash flow is a valuation method used to estimate the intrinsic value of a company based on the sum all of the available future free cash flows for the business, discounted back at the proper discount rate.
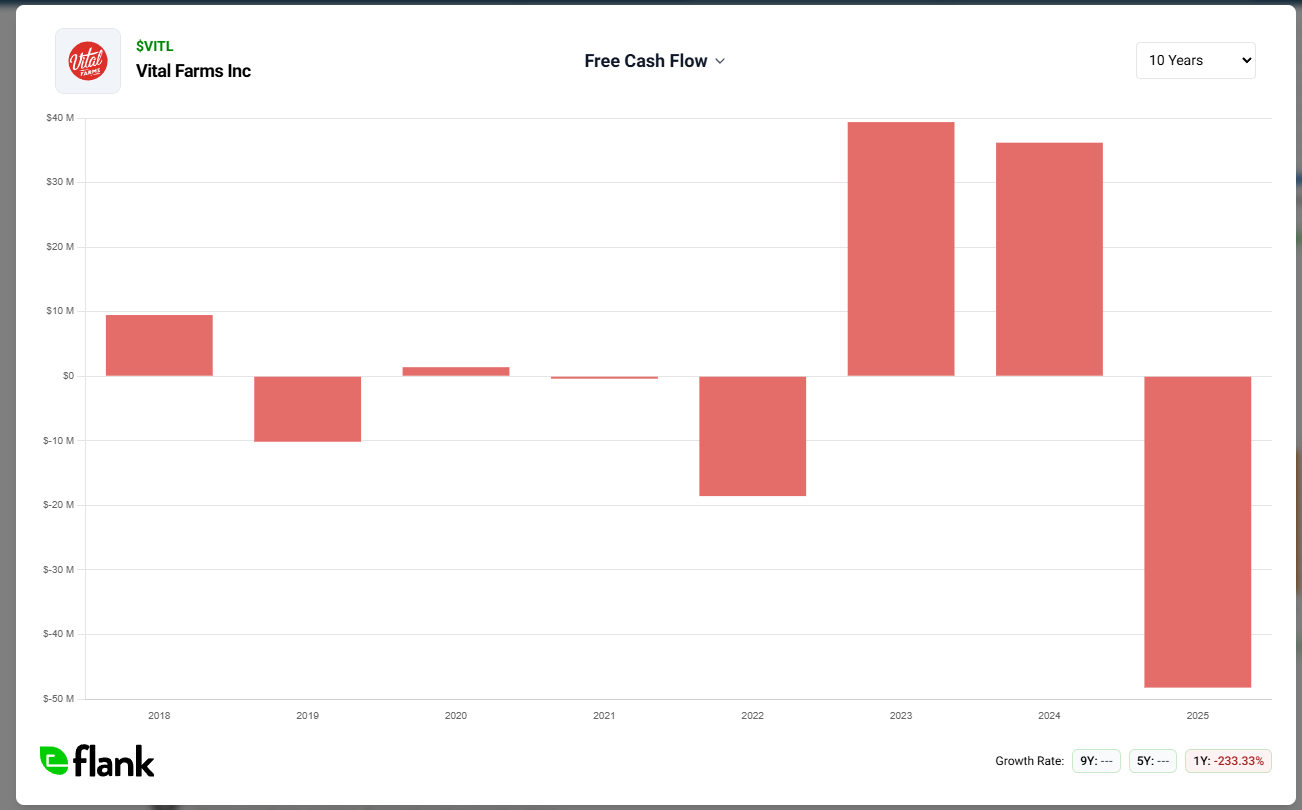
Here is the Free Cash Flows for Vital Farms over the last 8 years.
Very turbulent chart. There is a lot of noise baked into these numbers, as we explored previously, so it is important to understand the context of the business each year they are calculated. From my research into Vital Farms i know that the years they have big drops in FCF it is mostly from large CapEx spend to build out their two different facilities. The 2019-2021 dip is from the Vital Crossroads build out. The 2025 dip, likely to be the same for 2026, is from the Egg Central Station build out. These huge CapEx spends ate all of the FCF for that year and some. That to me is okay as i see it as investing in their facilities to improve future profitability. They also have done it in a way where the have entirely avoided debt. This allows them to be more resilient in market cycles that see consumer ability to purchase their premium eggs fluctuate.
My DCF Valuation for Vital Farms:
The numbers i used:
CAGR = 6%. I arrived at 6% from a few different assumptions. First using the 2018 number of ~$11 Million and the 2024 number of ~$36 Million and calculating the CAGR over that time period. The number calculated was 17.91%. I understand that the company has volatility in its FCF's and we are yet to see the full impact of the huge CapEx spend on that. Market cycles also caused a huge bump in FCF last year (2025) during the Avian flu outbreak but has since crashed premium egg prices as supply has normalized. This also will affect FCF moving forward. They called for total revenue of $1 Billion by 2030. From this years number of $760 Million, that puts as at a projected 6.4% YoY revenue growth over the next 5 years. To take all of these factors in to account I went with a conservative estimate of 6% for growth rate of FCF.
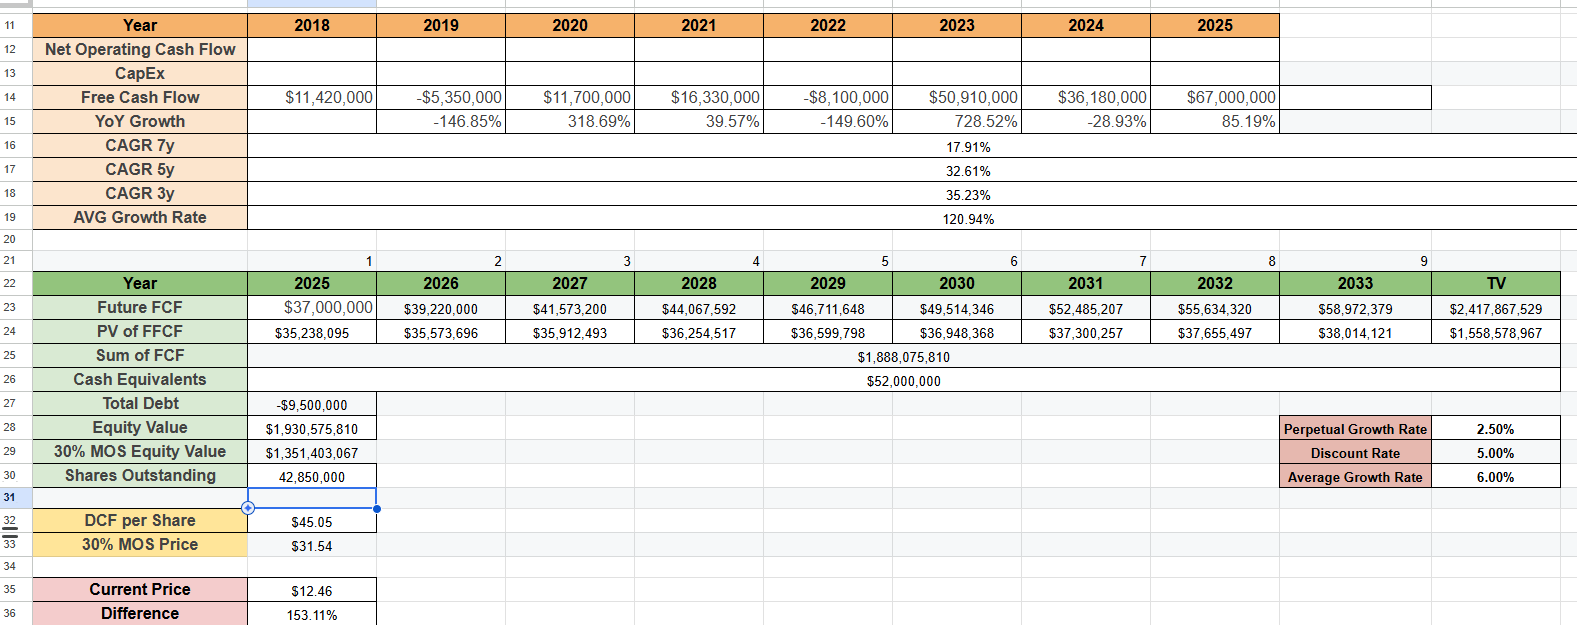
Discount Rate = 5%. This one was a little simpler. My assumption here is that the risk free rate is 5%. That is the current yield of 30 year treasuries.
Perpetual Growth Rate = 2.5%. This one is very conservative as well. This is typically aligned with the expected GDP growth of the economy. The number we have all heard is 3% GDP growth per year. I went with 2.5 as i am unsure of the ability of a premium egg seller to continuously compound into the future.
Margin of Safety = 30%. This one is going off of David's MOS of 30%. This one definitely needs further understanding.
Estimated Equity Value = $1.35 Billion. Per Share = $31.54
Current Equity Value = $533.91 Million. Per Share = $12.46
This model has Vital Farms as significantly undervalued at a 153.11%!! difference between current and estimated intrinsic value. If I like the Moat and Leadership of this company I will definitely be taking a position in my FIRST COMPANY!! Very fun.
Sentiment: Very Bullish
Understanding what a FCF is and the purpose of the DCF valuation method allowed me to be a little more informed in my assumptions using this model to come to a fair valuation. Ultimately this is just one piece of the story that is Vital Farms. I was very conservative in my valuations and tried to be pragmatic in my assumptions using the available information. Hope you enjoyed!