

ENLT
Enlight Renewable Energy Ltd
Balance Sheet Assessment
Understand The Balance Sheet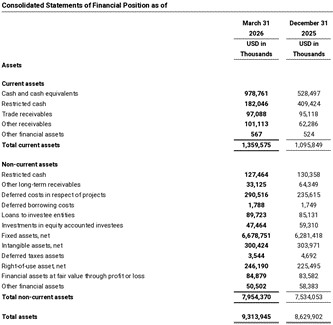
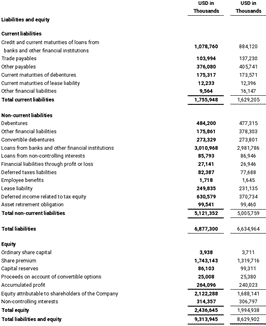
Enlight’s balance sheet is growing quickly with a 40% 5 year CAGR of both total assets and total liabilities generally growing in step year by year.
In Q1 2026 total assets increased 7.9% from $8.63 billion to $9.31 billion, primarily due to the growth of fixed assets by $397 million (6.3%) and cash and cash equivalents by $450 million (85%). And deferred project costs increased by $55 million (23%). Consistent with Enlight’s heavy construction programme. Total liabilities increased by 3.7%, while total equity increased 22.1%. The equity improvement was not primarily generated through retained earnings. Enlight issued approximately 7 million of new shares during the quarter, so most of the book-value growth resulted from raising new equity, existing shareholders experienced dilution.
The current ratio Q1 2026: $1.360bn / $1.756bn = 0.77
This compares with 0.67 at year-end 2025.
Net working capital therefore remains negative at approximately $396 million, although this improved from a $533 million deficit. I’m unsure if that is necessarily an immediate problem for Enlight.
Total cash including restricted cash was approximately $1.29 billion. The cash increase was largely financing-driven, including $419 million from issuing shares, $778 million of loan receipts and $121 million from tax-equity investors.
Total non current liabilities are approximately $5.1 billion, equivalent to roughly 2.1 times total equity.
Enlight reported net financial debt to EBITDA of 5.3 times and remained comfortably within its debenture covenants, although 5.3 times still represents substantial leverage despite being below the covenant limits of 15 to 18 times.