
General
What P/E Ratio did Buffett buy his best businesses?
I wanted to understand better what valuations looked like for some of the most famous Buffett buys. I'm also including some growth metrics, since P/E ratio in a vacuum tells you very little about a business
## Apple
P/E at Purchase: Berkshire began buying Apple stock in 2016 when Apple traded around 12–13 times trailing earnings (Apple’s FY2016 EPS was about $8.31 and the stock was ~$105–110). This relatively modest P/E reflected a market skeptical of Apple’s growth prospects at that time.
Revenue Growth (10y, 5y, 1y Pre-Purchase): Apple’s revenue exploded over the prior decade. From FY2006 to FY2016, revenue rose from roughly $19 billion to $216 billion (a ~27% CAGR) driven by the iPhone’s launch. In the five years before purchase (2011–2016), revenue roughly doubled (from ~$108B to $215.6B, about 15% CAGR). However, in the year before Berkshire’s major purchases, Apple’s sales actually dipped – FY2016 revenue of $215.6B was an 8% decline from $233.7B in FY2015 (a rare pullback after the iPhone 6 cycle).
You can see it in this graph at the 2016 YoY quarterly growth. Typical example of being greedy while others are fearful. Flank only has 10 year previous data, otherwise this would be easier to answer since Flank breaks out CAGR.
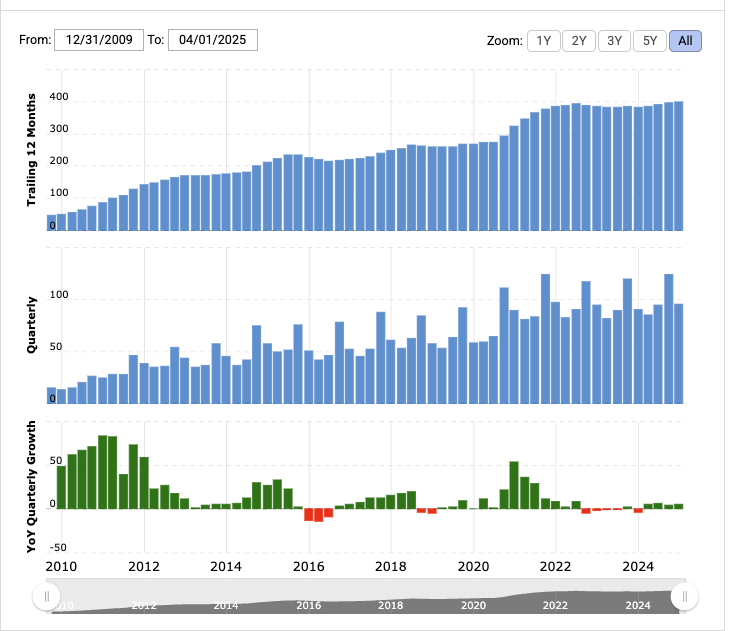
Net Income Growth (10y, 5y, 1y Pre-Purchase): Apple’s net income also surged over the decade. It grew from about $2 billion in 2006 to $45.7 billion by 2016, a spectacular CAGR in the mid-30% range. In the five years prior, net income rose from $25.9B in 2011 to $45.7B in 2016 (~12% annualized). However, like revenue, net income dipped recently – FY2016 profit of $45.7B was down 14% from $53.4B in FY2015 due to a maturing smartphone market.
Total Assets & Liabilities (2016): At purchase time Apple had a massive balance sheet. As of Sept 24, 2016, total assets were $321.7 billion, including a huge cash stockpile, and total liabilities were $193.4 billion (about $108 billion of which was long-term debt and the rest current liabilities). This left substantial shareholders’ equity (~$128B). Apple’s financial position was extremely strong, with large liquidity.
Free Cash Flow (FCF) at Purchase: Apple was a cash machine. In FY2016, operating cash flow was $65.8 billion. After capital expenditures of about $12.8 billion , free cash flow was roughly $53 billion. Apple’s FCF yield at Berkshire’s entry price was on the order of 8–9%, highlighting why Buffett found it attractive. (Notably, Apple’s FCF had grown by ~$10B over the preceding decade, illustrating tremendous cash generation.)
## Bank of America (2011 Investment)
P/E at Purchase: Buffett’s initial $5B investment in Bank of America in 2011 took the form of preferred stock with warrants, made when BofA’s common stock was depressed below $7. At that time, BofA’s earnings were near zero – the bank was just breakeven to slightly profitable in 2011 (only $1.4B net income for the full year). Thus the common stock’s trailing P/E was not meaningful (essentially infinite) due to negligible earnings. On a normalized basis (excluding crisis-era charges), BofA was arguably around 10× forward earnings in 2011 – but essentially, Buffett was investing at “no earnings” prices because the market feared BofA’s credit losses. I want to note that Banks are not analyzed the same way that other businesses are, but my main point here is to not be dogmatic about valuations.
Revenue Growth (10y, 5y, 1y Pre-Purchase): BofA’s revenues had shrunken coming out of the financial crisis. Over the 2001–2011 decade, revenue grew from about $33B to $94.4B (roughly 11% CAGR, mostly via acquisitions like Countrywide and Merrill). But five-year trends were negative: 2006 revenue was $73B, so by 2011 ($94B) growth was only ~5% annualized, and much of that came from 2008 acquisitions. From 2010 to 2011, net revenue fell 15% (from $111.4B to $94.4B) as new regulations and low interest rates hit the bank. In short, BofA’s top line was still down from pre-crisis levels – hardly a growth story at purchase time.
Net Income Growth (10y, 5y, 1y Pre-Purchase): BofA’s earnings history was grim in the crisis aftermath. The bank lost $2.2B in 2010 and eked out a $1.4B profit in 2011 – far below pre-2008 norms. A decade earlier (2001), BofA earned around $6–7B; it peaked at $21B in 2006, then swung to large losses in 2009–2010. So 10-year “growth” was negative. Even excluding crisis charges, five-year earnings collapsed (2006 net $21B vs. ~$1–$2B in 2011). From 2010 to 2011, reported net income improved from a $2.2B loss to a $1.4B gain – but essentially, earnings were near zero. Buffett was effectively betting that BofA’s profits would rebound in the future (which they did, to ~$29.9B by 2024) rather than focusing on historical growth rates.
Total Assets & Liabilities (2011): Bank of America in 2011 was enormous and heavily leveraged. At year-end 2011, total assets were about $2.13 trillion (down from $2.34T in 2010) while total liabilities were roughly $1.93T. The bank’s tangible common equity was much smaller ($130B). Essentially, BofA’s balance sheet in 2011 was 90% liabilities (deposits, bonds, etc.) and 10% equity – typical for a large bank. Notably, BofA’s regulatory Tier 1 common capital ratio was ~9.9% in Q4 2011 after Buffett’s deal shored up confidence. The sheer scale of assets and slim equity buffer is why the market was so fearful (trading at about 0.6× book value in 2011).
Free Cash Flow at Purchase: Free cash flow isn’t a very useful metric for banks. So in BofA's case, Buffett bought at an infinite P/E ratio lol.
## Moody’s (2000 Investment via Spinoff)
P/E at Purchase: Berkshire became a Moody’s shareholder around 2000, when Moody’s was spun off from Dun & Bradstreet. At that time, Moody’s stock traded around the low $30s, and the company earned about $1.30 per share in 2000 – a P/E on the order of 23×. However, Buffett obtained many of his shares essentially by owning D&B pre-spinoff, at a much lower effective multiple. On a cash basis, Berkshire’s stake cost only ~$248 million (an effective per-share cost under $10). Relative to Moody’s $1.20 EPS in 2000, Berkshire’s look-through P/E was in the high single digits – a steal. Even at market prices post-spinoff ($33/share), Moody’s P/E (~25× trailing) reflected investors’ expectation of strong growth in the credit-ratings oligopoly.
Revenue Growth (10y, 5y, 1y Pre-Purchase): Moody’s had been a steady grower. In the decade before 2000, revenue roughly doubled from about $250M in 1990 to $564M in 1999 – roughly 7% CAGR (with acceleration in late 90s due to bond market growth). In the five years pre-spinoff (1995–1999), revenue grew around ~14% annually (from $423M to $564M). The year 1999 saw revenue up ~9.8% (to $564.2M from $513.9M in 1998, excluding a divested unit). By 2000, Moody’s revenue jumped to about $687M (boosted by strong bond issuance) – robust growth heading into Buffett’s purchase.
Net Income Growth (10y, 5y, 1y Pre-Purchase): Earnings grew even faster than sales, as Moody’s enjoys high operating leverage. From 1990 to 1999, net income (excluding one-time items) rose from roughly $50M to $155.6M – about 12% CAGR. In the five years prior (1995–1999), net income grew ~15–16% annually (from ~$80M to $155.6M). In 1999, Moody’s net income increased 9.6% to $155.6M (or 11.9% on an adjusted basis, excluding a small gain) as margins expanded. By 2000, net income was about $170M. Overall, Moody’s showed strong double-digit profit growth – exactly what attracted Buffett. (He first bought D&B (Moody’s predecessor) in 2000, noting the “virtually infinite returns on tangible capital” of the ratings business.)
Total Assets & Liabilities (2000): Moody’s balance sheet was relatively light. At separation in 2000, Moody’s had roughly $1.2 billion in total assets and about $450 million in total liabilities (including ~$130M of debt). This left shareholders’ equity around $750M. The business model is wonderfully capital-light – most assets were goodwill/intangibles and receivables, with minimal physical assets. In fact, Moody’s maintained a negative working capital (customers pay upfront), which effectively funds the business. The modest debt was easily covered by cash flow. In short, Moody’s had low capital requirements and little leverage at the time of Buffett’s investment, enhancing returns on equity (which exceeded 25%).
Free Cash Flow at Purchase: Moody’s was a cash cow then and now. In 2000, it earned about $170M net and had depreciation under $20M, while capital expenditures were only ~$15M. So Moody’s free cash flow was roughly $170M – nearly identical to net income, since the business requires minimal capex. (Indeed, Moody’s converted ~100% of earnings to FCF.) This FCF was being used to pay dividends and buy back shares – management and Buffett both liked that. Buffett’s effective yield on his stake (based on his cost) was extraordinarily high – by 2023, Berkshire’s $248M investment was throwing off over $110M in annual look-through earnings. In summary, Moody’s financial profile at purchase featured high margins, low capital needs, and abundant free cash flow, a quintessential Buffett business.
## Kraft Heinz (2013–2015 Purchases)
P/E at Purchase: Berkshire’s investment in Kraft Heinz came via two deals: the 2013 acquisition of Heinz (with 3G Capital) and the 2015 merger of Heinz with Kraft. The effective valuation was rich. In 2013, Berkshire and 3G paid about $23.3B for Heinz, roughly 20–21× Heinz’s earnings (Heinz earned $1.1B in 2012). In 2015, when Kraft merged with Heinz, Kraft’s stock was around $85 – over 30× its pre-merger EPS ($2.50). On a combined basis, KHC traded near 20× pro-forma earnings at merger closing. In short, Buffett paid a full price (P/E in the low 20s) for an iconic but slow-growing food business, albeit with expected cost synergies. (This high multiple later caused some heartburn – by 2018 KHC’s stock had collapsed and taken a goodwill write-down.)
Revenue Growth (10y, 5y, 1y Pre-Purchase): Kraft and Heinz were both mature, low-growth businesses. Heinz’s revenues grew only ~3% annually in the decade before 2013 (organically flat, with some boost from emerging markets). Kraft’s North American grocery business was essentially flat in the early 2010s. In the five years pre-merger (2010–2014), Kraft Foods Group’s net sales actually declined slightly (from $18.3B in 2010 to $18.2B in 2013–2014) due to divestitures and weak volume – organic growth was roughly 0%. Heinz’s sales were similarly stagnant ($11B in 2012 vs $10.9B in 2008). The year before the merger, 2014, combined Kraft + Heinz revenue was about $28 billion (pro-forma), roughly flat vs 2013. For Kraft alone, 2013 net sales were down 0.3% to $18.2B. Thus, virtually no revenue growth – Buffett was buying stable cash flows rather than growth.
Net Income Growth (10y, 5y, 1y Pre-Purchase): Profit growth was also modest. Heinz’s net income hovered around $900M–$1B in the early 2010s (up from ~$600M in 2003 – mid-single-digit CAGR). Kraft’s standalone earnings were influenced by cost cuts – 2013 EPS of $4.51 was higher than prior years due to one-time pension gains, but on an underlying basis Kraft’s operating income grew ~5% in 2013. Over 2010–2014, Kraft’s adjusted EPS rose from ~$2.00 to ~$2.20 (barely 2% annually). In the year before merger, Kraft’s operating profit excluding special items rose ~5%, and Heinz’s operating profit grew similarly (~5% in 2014). Essentially, earnings were growing in the low-to-mid single digits at best, driven by cost efficiencies rather than sales. Buffett was counting on further cost reductions via 3G’s management to boost sluggish profits.
Total Assets & Liabilities (2015): The merged Kraft Heinz had a large balance sheet loaded with goodwill. At end of 2015, The Kraft Heinz Company had $122.97 billion in total assets (swelled by merger intangibles) versus $62.8B in total liabilities. Shareholders’ equity was about $60B. The liabilities included roughly $23 billion of long-term debt and the rest in current liabilities and deferred taxes. The debt level gave a Debt/EBITDA around 4× – somewhat high but deemed manageable with low interest rates. Essentially, Buffett’s food conglomerate carried significant leverage and goodwill (later in 2018–2019, KHC wrote down $15B of goodwill). The combined company’s financial footing was solid in terms of liquidity, but it had a large $intangible asset base (brand value) and needed to reduce debt gradually. Buffett took comfort that strong cash flows and cost cuts would support the debt – which largely proved true, though growth remained elusive.
Free Cash Flow at Purchase: Both Heinz and Kraft generated solid free cash flow, which was a key attraction for Buffett. In Kraft’s last year before merger (2013), free cash flow was about $1.5 billion after capital spending – beating expectations via working capital improvements. Heinz in 2012 had FCF around $0.7–0.8B (operating cash ~$1B minus capex ~$300M). The merged Kraft Heinz in 2015 produced roughly $2+ billion in pro-forma FCF. For example, in FY2015 Kraft and Heinz together had about $2.7B operating cash flow and $0.7B capex, for ~$2.0B FCF. These consumer staples businesses require relatively low capex (KHC’s capex ~2–3% of sales). Buffett clearly valued that predictable cash generation – the company could pay dividends (initially $2.35/share annually) and pay down debt. However, with flat earnings, FCF didn’t grow much post-merger. In summary, at purchase Buffett got a roughly 3–4% FCF yield on the deal – not cheap, but for franchises like Heinz, he and 3G expected to increase that yield via efficiency moves (which occurred, though later offset by profit declines in 2017+).
## Coca-Cola (1988 Purchase)
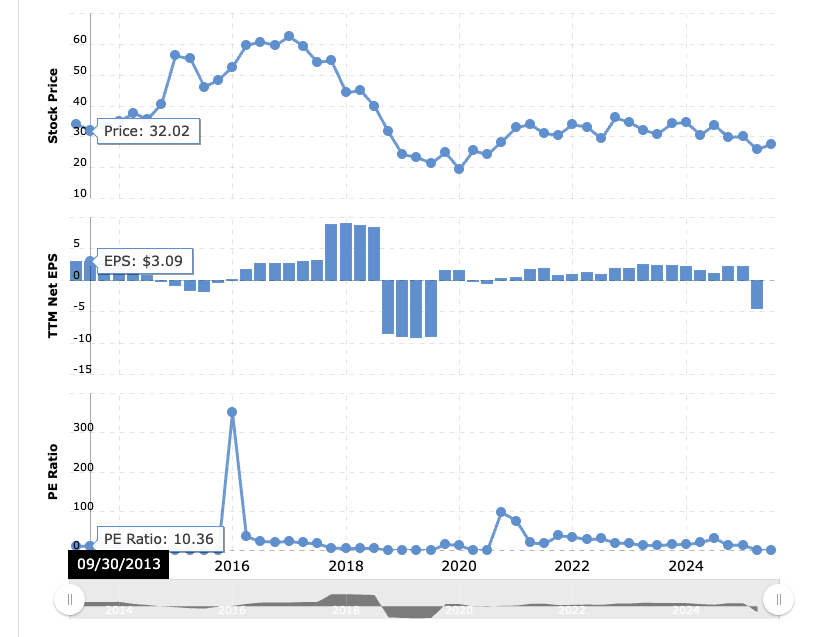
P/E at Purchase: When Buffett started buying Coca-Cola in 1988, the stock traded at about 15× trailing earnings. Coke earned roughly $1.03 billion in 1988 ($2.84 EPS), and the stock was around $44.50 at year-end 1988. Thus the trailing P/E was ~15.5 – a reasonable multiple given Coke’s strong brand and growth prospects. (For context, Coke’s P/E would later skyrocket – a decade after Buffett’s purchase, it was ~45× earnings during the 1998 market bubble.)
Revenue Growth (10y, 5y, 1y Pre-Purchase): Coca-Cola’s revenues had been growing at a high-single-digit pace. From 1979 to 1988, net sales climbed from $3.9 billion to $8.34 billion – about 8–9% CAGR over that 10-year span. In the five years before Buffett’s buy (1983–1988), sales grew ~10.5% annually (from $5.06B to $8.34B) as Coke expanded internationally. The year before purchase, 1988, revenue rose ~8.9% (to $8.338B from $7.658B in 1987) – solid single-digit growth. From multiple shareholder meetings, I believe that Buffett bought Coca-Cola because of their economic moat moreso than for growth prospects.
Net Income Growth (10y, 5y, 1y Pre-Purchase): Coca-Cola’s earnings growth was even stronger, reflecting margin expansion (which Buffett loves to see). Between 1979 and 1988, net income more than doubled from $420M to $1.038B (~10–11% CAGR). Over the five years pre-purchase, earnings grew about 13% annually (from $559M in 1983 to $1.038B in 1988) – boosted by Goizueta’s strategies. In 1988, net income jumped 13% year-over-year (from $916M in 1987). Coke was consistently improving profits through the 80s, with EPS climbing ~17% in 1988 alone.
Total Assets & Liabilities (1988): At year-end 1988, Coca-Cola had about $7.45 billion in total assets. Liabilities summed to roughly $4.4B (including $760M of debt), and shareholders’ equity was $3.05B. Coke’s balance sheet was relatively light – it had ~$1.23B cash on hand and only $760M of total debt. This conservative financing (debt <11% of assets) and strong equity cushion reflected Coke’s robust financial health and low capital needs.
Free Cash Flow at Purchase: Coke generated substantial free cash flow even in the late 1980s. In 1988, net income was $1.038B and depreciation ~$170M; capital expenditures were about $387M. Thus FCF was on the order of $600–700 million in 1988. (A precise estimate from analysts puts 1988 FCF around $610M.) This strong FCF – roughly 7% yield on Coke’s ~$9B market value at year-end 1988 – demonstrated the cash profitability of Coke’s franchise. Buffett clearly loved that Coca-Cola could pay healthy, growing dividends while still investing in marketing and growth.
I also reviewed many other companies, including AMEX, Marmon Group, BNSF, Duracell, GEICO, Lubrizol, and more. It seems that his "sweet-spot" is a trailing PE ratio of 12-15, but he certainly does not stick to that as law. He will buy any company that makes sense.
The best analogy for PE ratio that I've heard is that it's similar to flying a plane. Pilots look at many indications/instrumentation when flying. PE ratio is like altitude. It's certainly important, but it's not the only indication that they evaluate.
Thanks for reading :)