
ASML
ASML Holding NV
Understand The Income Statement
Understand The Income StatementASML – Value Investor Income Statement Analysis (2014–2024)
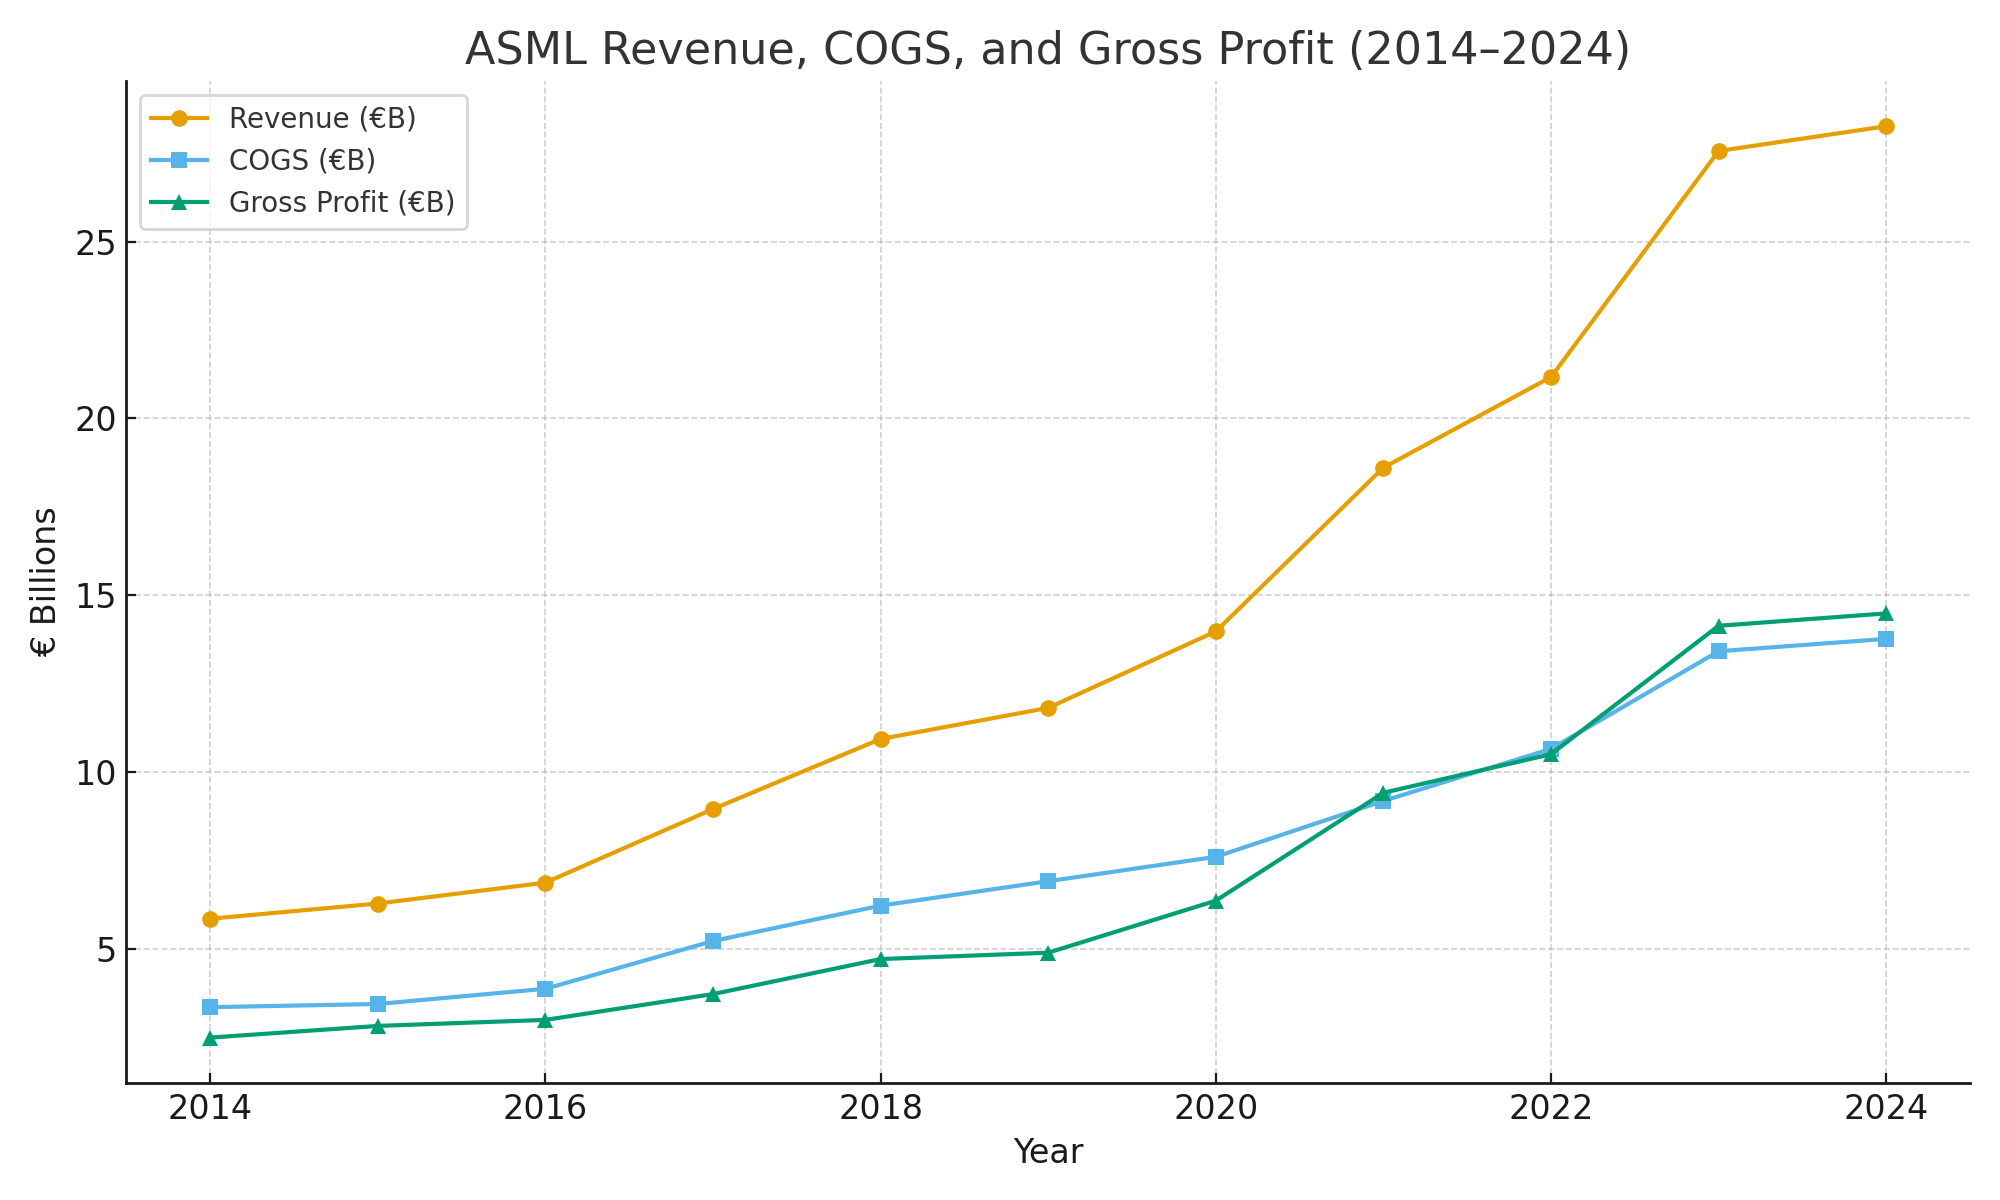
1. Revenue:
2014: €5.9B → 2024: €28.3B (CAGR ~19%).
Inflection points:
2017–2019: EUV ramp (TSMC, Samsung, Intel first adopters).
2020–2021: AI/data center buildout.
2023–2024: slowdown from memory downturn & China export bans.
Installed base services grew to €6.5B (~23% of total, recurring).
Value lens: Fisher → sustainable growth anchored in technological innovation and necessity.
2. Cost of Goods Sold (COGS)
2014: €3.4B → 2024: €13.8B (CAGR ~15%).
Slower growth than revenue → margin expansion.
Drivers: EUV initially expensive but supplier integration (Zeiss, Trumpf, Cymer) improved efficiency.
Value lens: Buffett → scalable cost base proves moat strength.
3. Gross Profit
2014: €2.5B → 2024: €14.5B (CAGR ~24%).
Service & upgrade contracts carry >55% gross margins.
EUV shifted from loss-making to profit driver after 2018.
Value lens: Munger’s “Lollapalooza” → monopoly + pricing power + scale → exponential compounding.
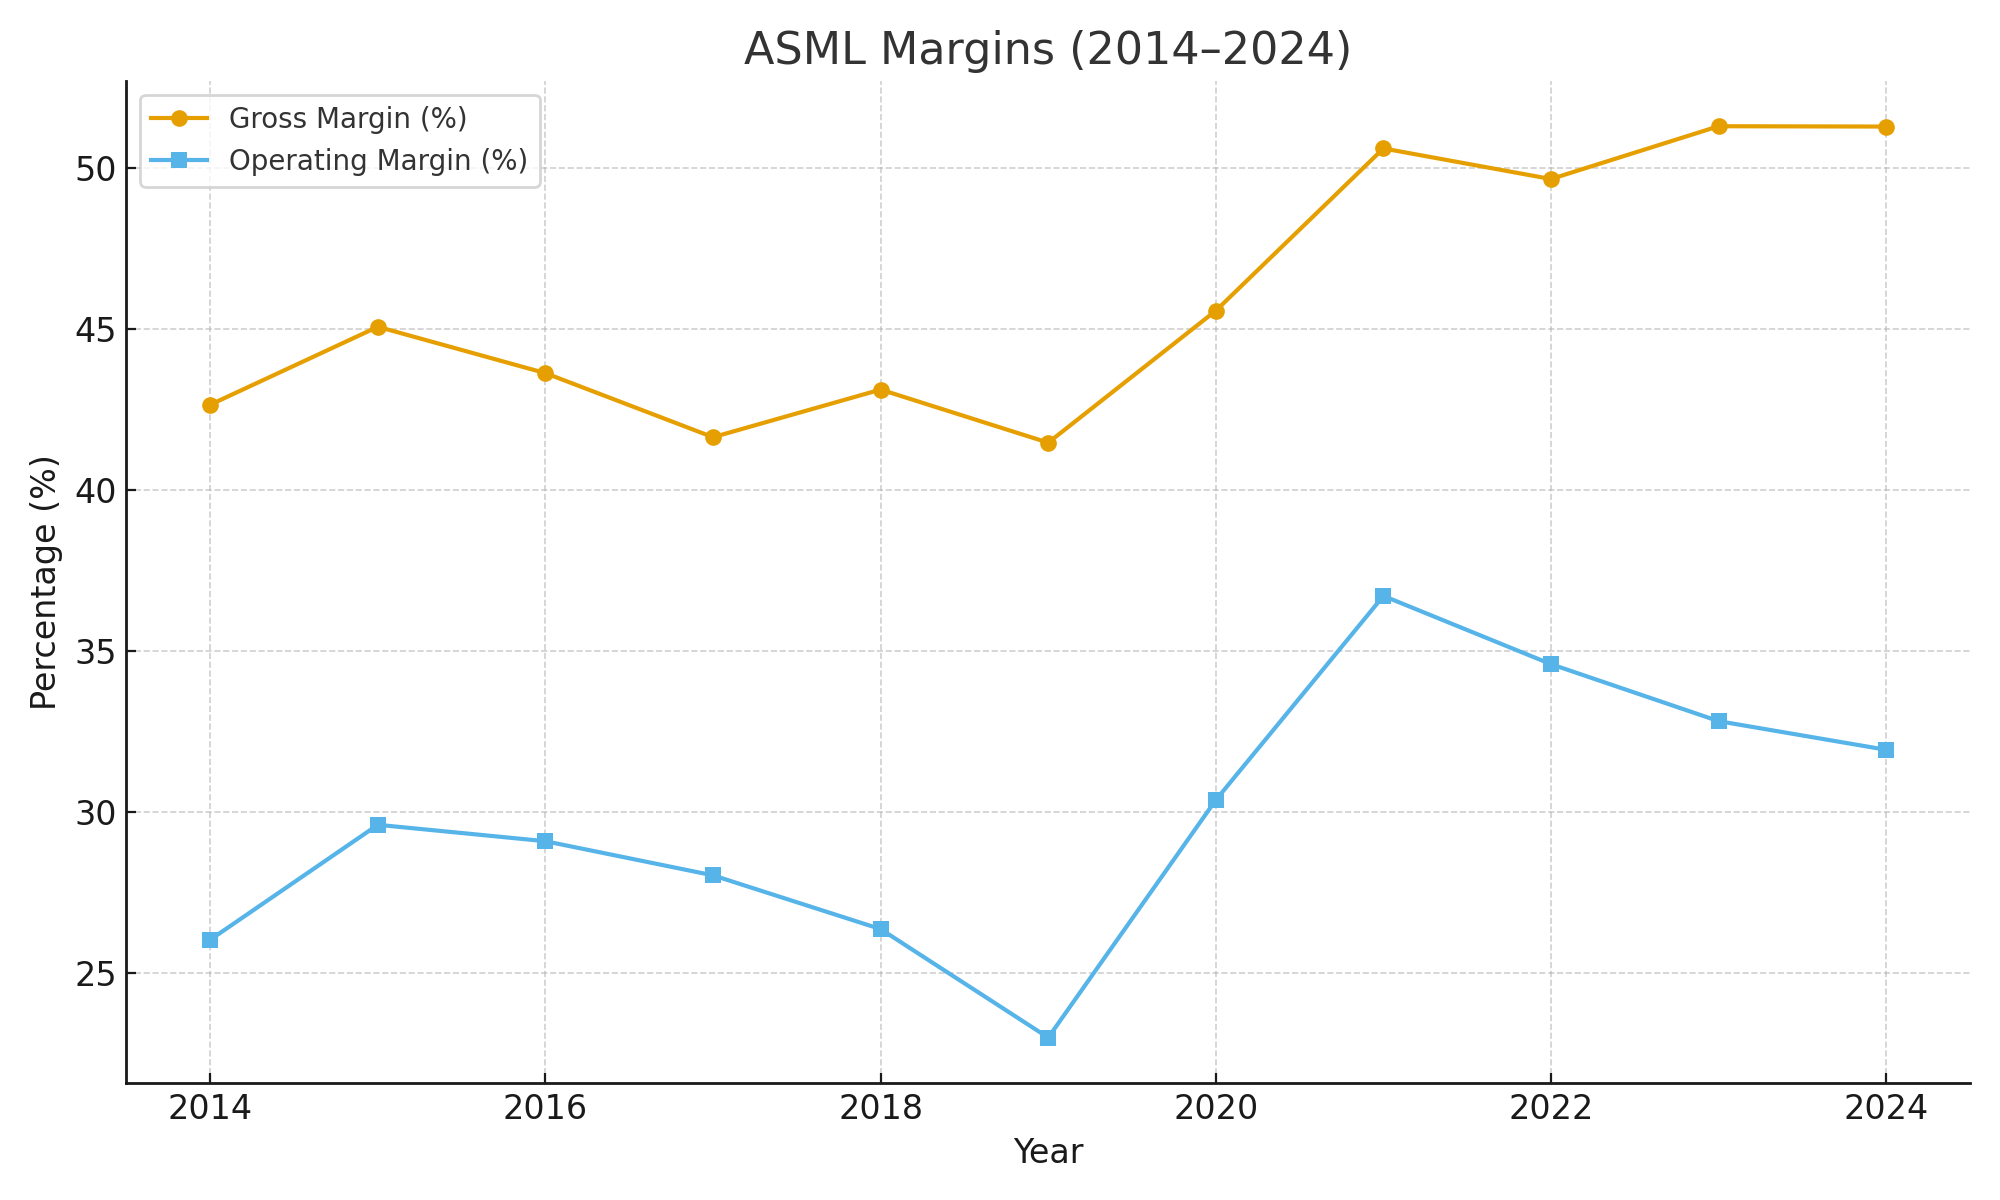
4. Gross Profit Margin
2014–2018: 41–45%.
Post-2020: stable at 50–52%.
Lift driven by EUV maturity & high-margin services.
Value lens: Margin step-up = evidence of durable moat (Buffett: “economics that endure”).
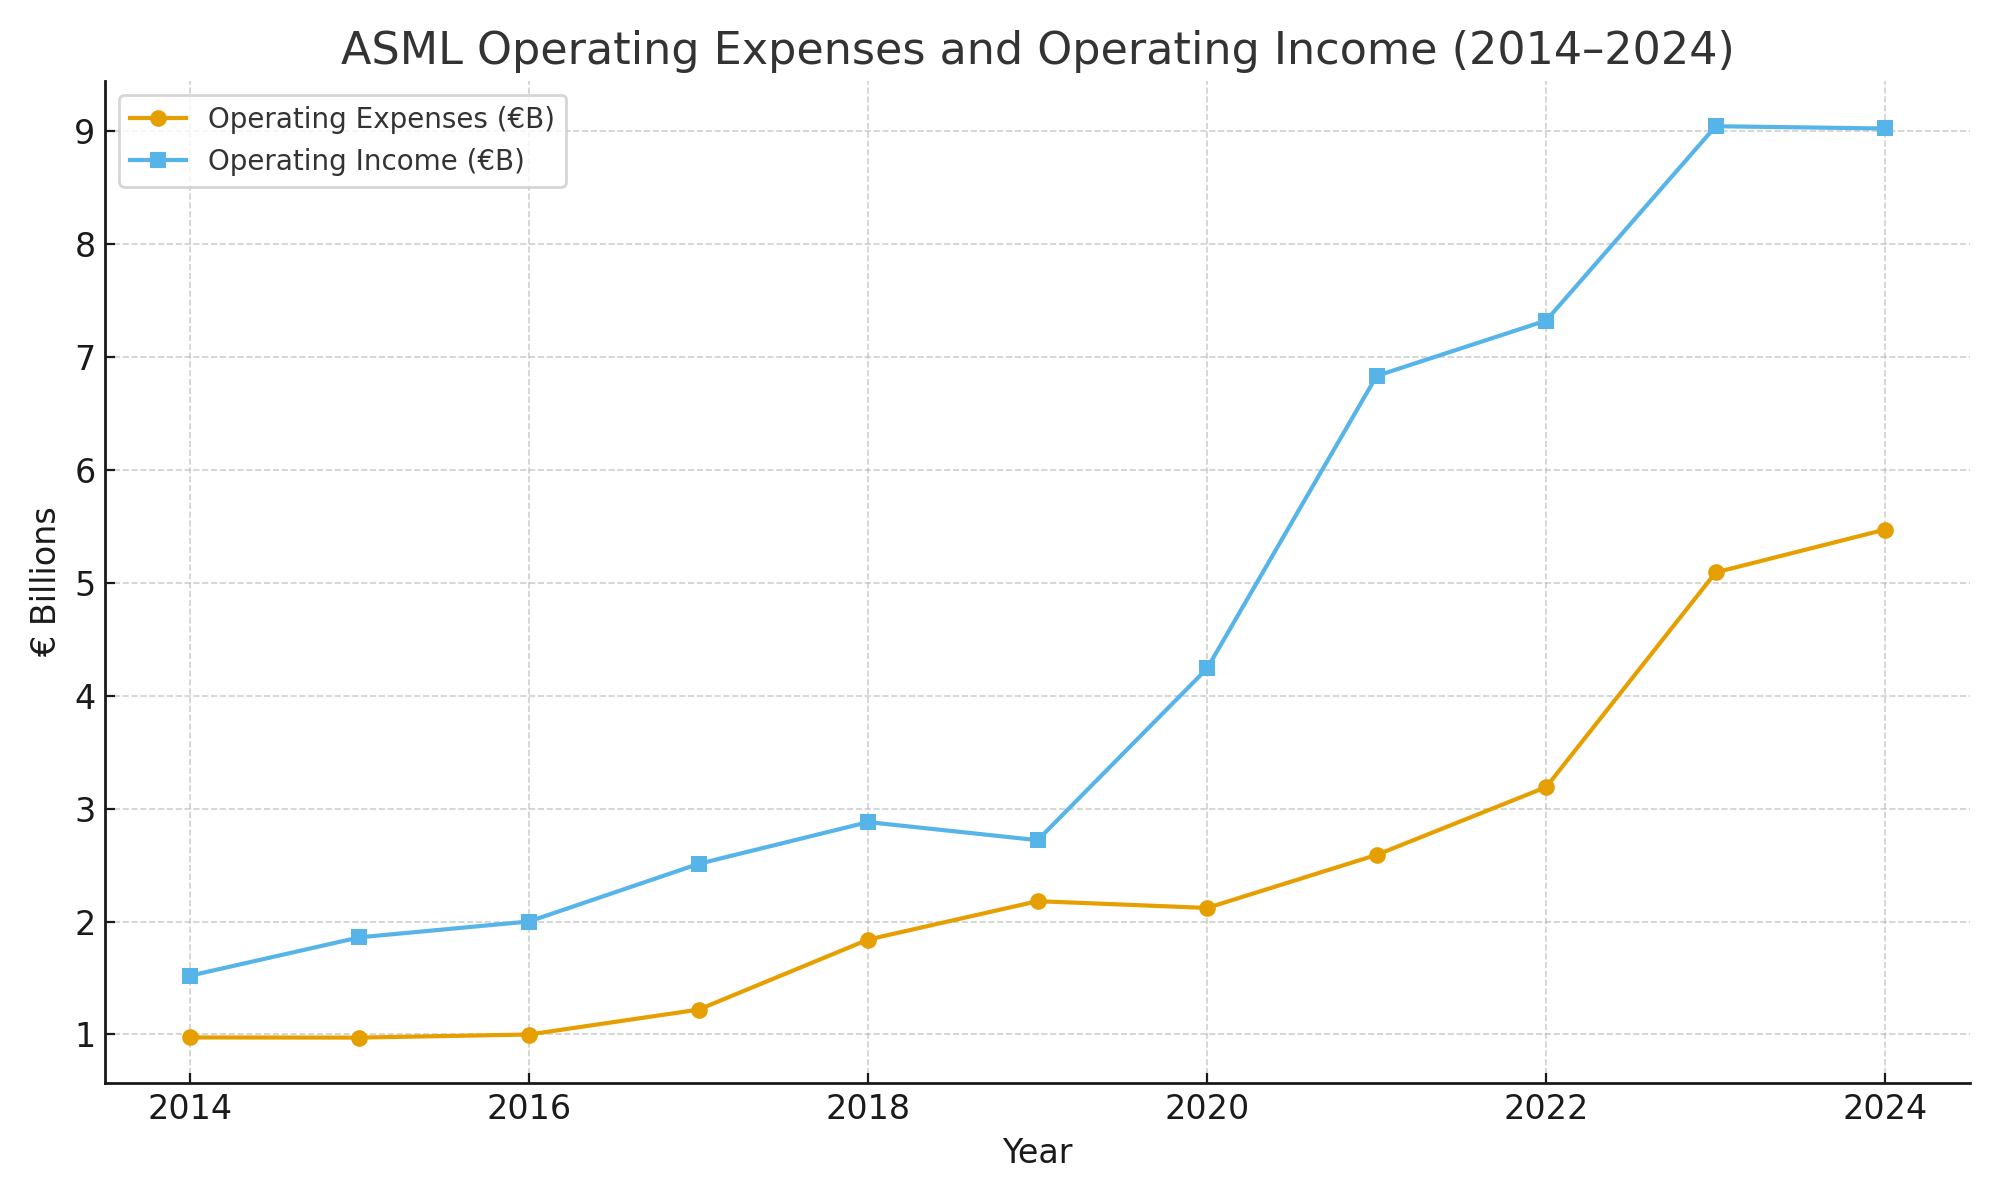
5. Operating Expenses
2014: €1.0B → 2024: €5.5B (CAGR ~20%).
R&D ~€4.3B (15% of sales), SG&A ~€1.1B (4–5%).
Focus: High-NA EUV, holistic lithography, computational & AI-enabled design tools.
Value lens: Fisher → high, consistent R&D is moat-building, not wasteful.
6. Operating Income
2014: €1.5B → 2024: €9.0B (CAGR ~19%).
Dip in 2019 from EUV ramp, then strong acceleration post-2020.
Value lens: Greenblatt’s Magic Formula → high ROC with growth → top-tier compounder.
7. Operating Margin
2014–2016: 26–29%.
2019: fell to 23% (EUV ramp costs).
2021: peaked at 37% (AI supercycle).
2024: ~32%.
Value lens: Munger → temporary margin pain was moat investment, not structural weakness.
8. Total Other Income
Small (~€0.3–0.4B).
Net interest + small equity stakes.
Value lens: Buffett → true earnings come from operations, not financial tricks.
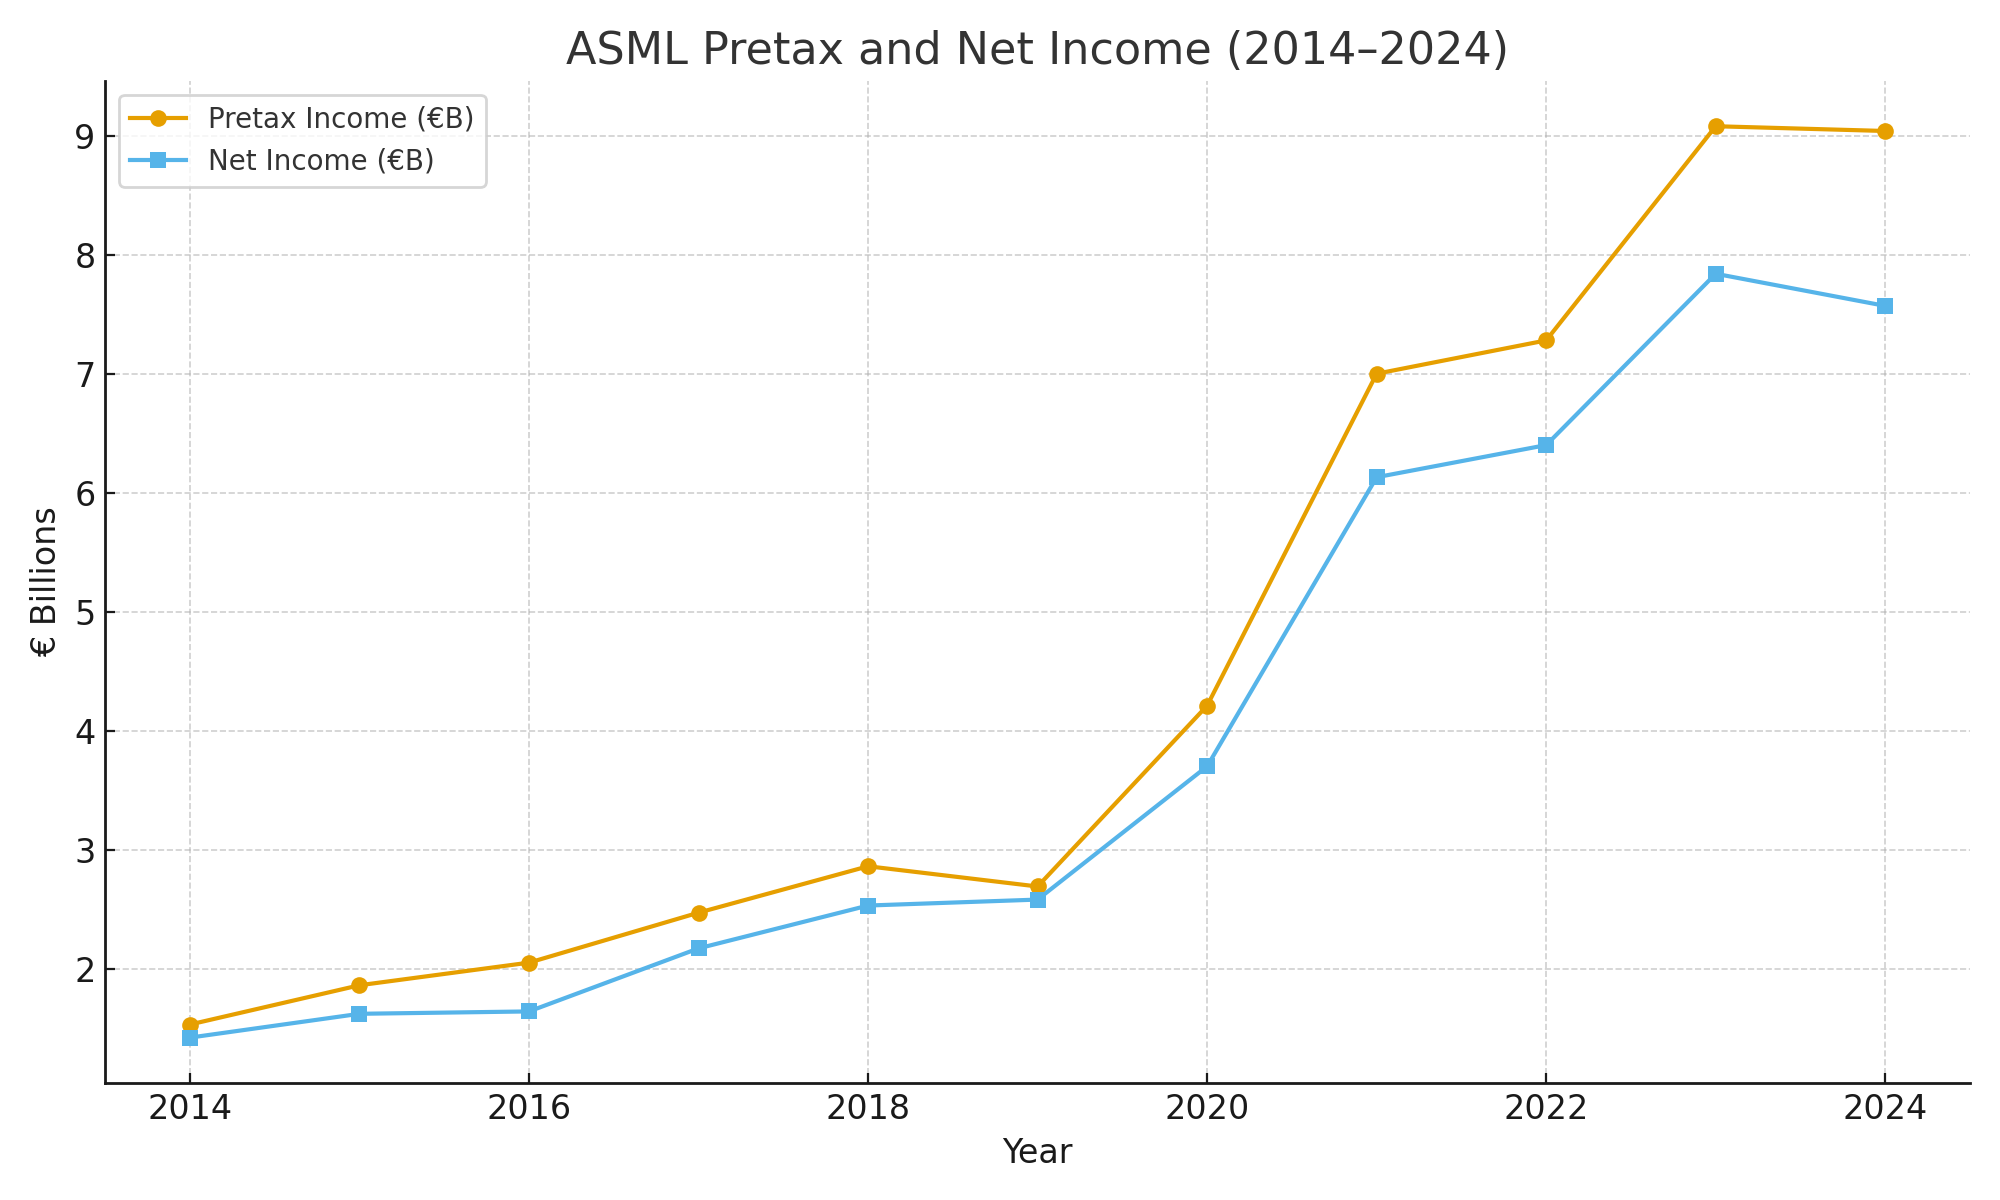
9. Pretax Income
2014: €1.5B → 2024: €9.0B (CAGR ~18%).
Clean alignment with operating income (no distortions).
Value lens: Buffett → pretax income is the cleanest check of business quality.
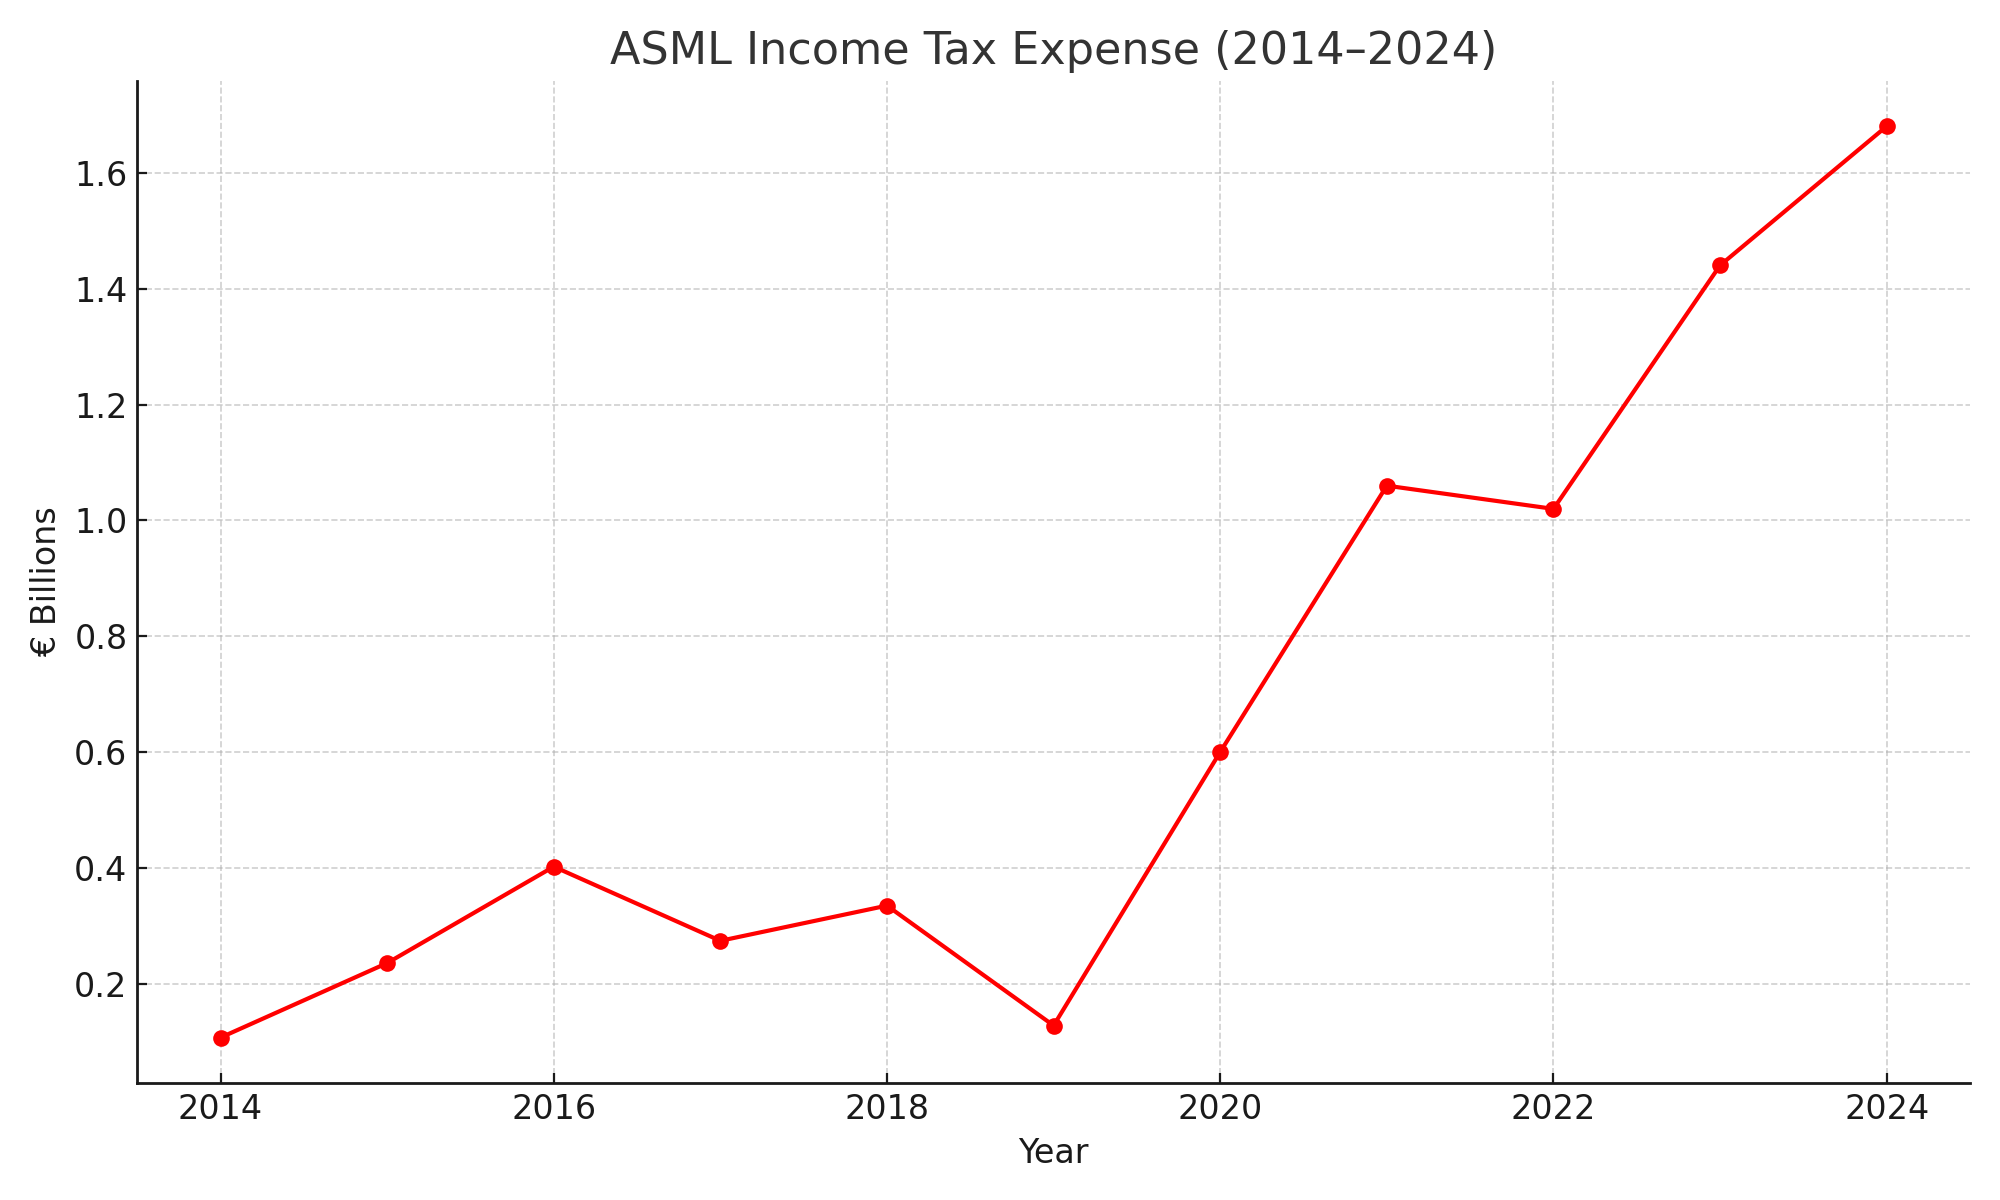
10. Income Tax Expense
2014: €0.1B → 2024: €1.7B.
Effective tax rate ~16–19%, fairly stable.
Netherlands tax incentives & R&D credits help.
Value lens: Klarman → predictable tax = stable compounding, reduces downside risk.
11. Net Income
2014: €1.4B → 2024: €7.6B (CAGR ~18%).
Spike in 2021 from AI/EUV demand, stable at high levels in 2023–24.
Value lens: Lynch → earnings drive stock prices; consistency proves durability.
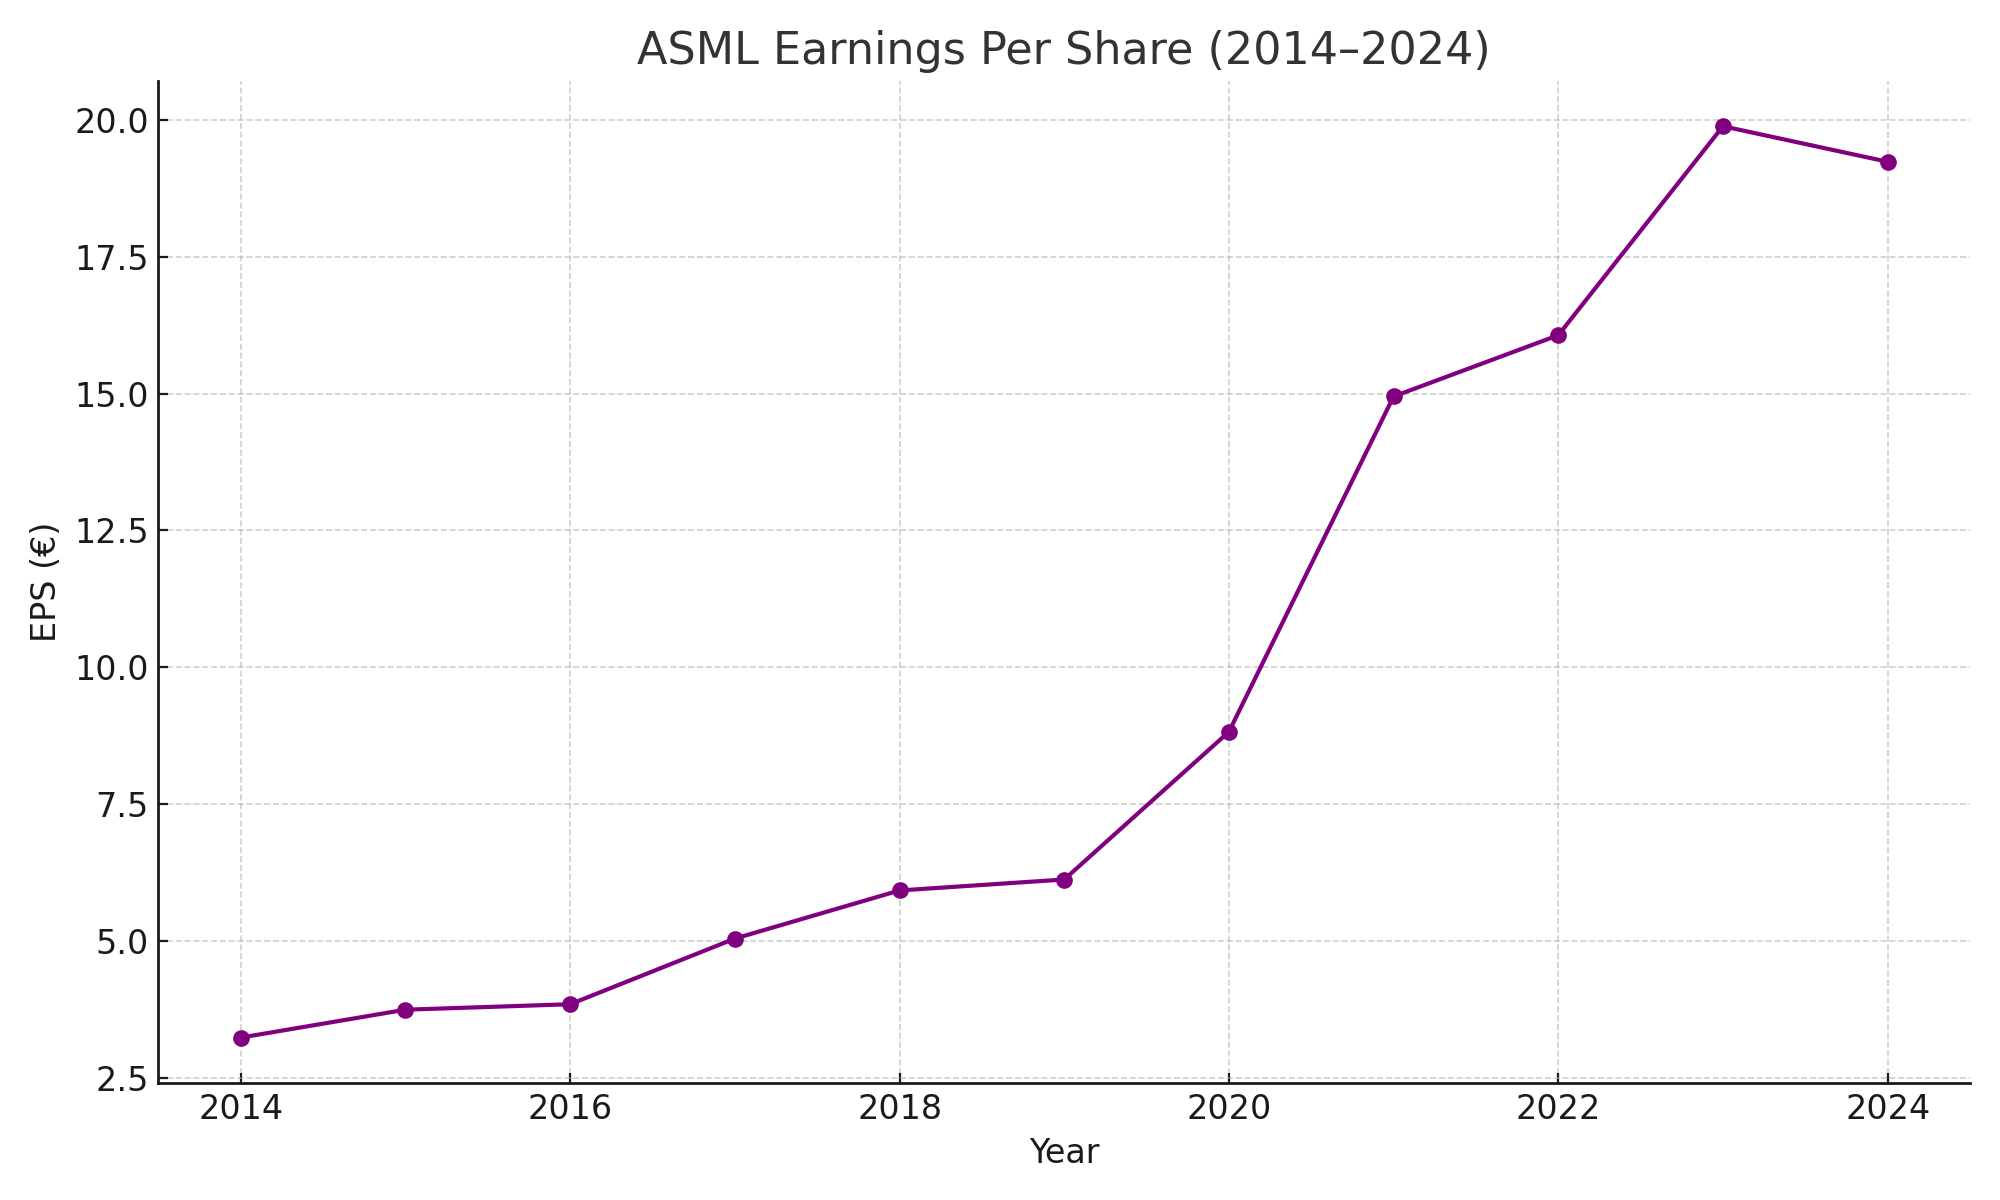
12. Earnings Per Share (EPS)
2014: €3.23 → 2024: €19.24 (CAGR ~21%).
Boosted by share buybacks and strong dividends (€6.40/share in 2024).
Value lens: Buffett → EPS compounding = true “owner’s earnings” growth.
Different people perspectives like I researched/imagine them from books, interviews, personal knowledge and articles:
Buffett/Munger: ASML = wonderful business, monopoly-like economics, recurring revenues.
Fisher: Relentless innovation and customer trust ensure long runway.
Greenblatt: High ROC and profit growth rank ASML at the very top.
Klarman/Marks: Margin of safety thin at P/E ~35–40; best entry is during downturns.
Lynch: Fast grower that is also unusually durable.
Conclusion:
ASML is the ultimate compounding machine: over 15 years of >15% EPS growth, structural margin step-up, and a monopoly-like moat. The only limitation is valuation — expensive at current multiples. Strategy: hold long-term for compounding, and buy aggressively during semiconductor downturns or geopolitical shocks when market offers a discount from my perspective.
Please let me know if I’ve missed or overlooked anything, made a mistake, or if you have any questions or suggestions for improving the analysis!